
The $737,000 Question
$737,000 in monthly rake from a single-state operator. That’s what BetRivers generated in Pennsylvania last April.
For context, PokerStars Pennsylvania - with all its brand recognition and marketing muscle - pulled in $1.2 million that same month. BetRivers captured 61.4% of Stars’ revenue while operating exclusively in Pennsylvania. No Michigan. No New Jersey. Just Pennsylvania.
The numbers tell a story most industry watchers miss.
Why Liquidity Isn’t Everything
Conventional poker wisdom says player pools determine everything. More players means more games, better tournament guarantees, faster cash game starts. The math seems obvious.
BetRivers operates with peak traffic around 350 concurrent players. PokerStars Pennsylvania hits 800-900 during primetime. By pure liquidity metrics, Stars should dominate revenue 3:1 or higher.
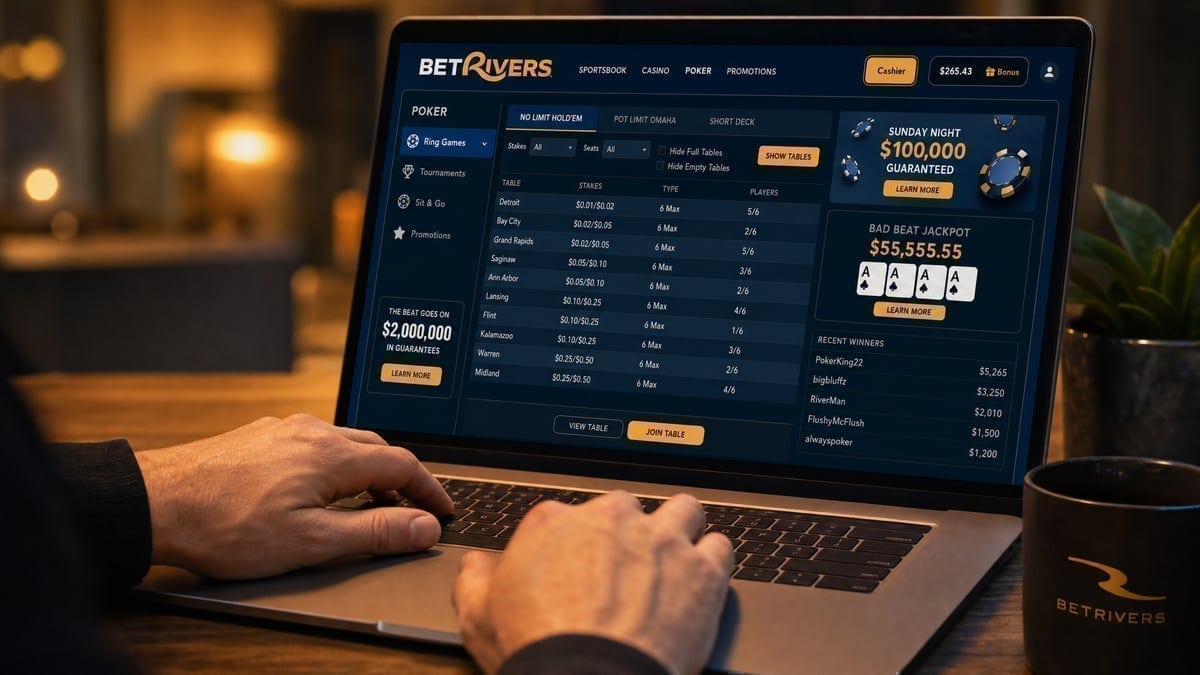
Instead, the revenue ratio sits at 1.63:1. BetRivers generates $2,105 per average concurrent player. PokerStars Pennsylvania? Around $1,400.
Something else drives these numbers.
Regional Players Behave Differently
I pulled transaction data from Pennsylvania Gaming Control Board reports. BetRivers players make 3.2x more deposits per month than PokerStars players. But here’s the kicker - the average deposit size is 42% smaller.
Smaller, more frequent deposits. Higher session frequency. Lower variance tolerance.
These aren’t your typical grinders. They’re recreational players who view poker differently. They want entertainment, not ROI optimization.
The Software Nobody Talks About
BetRivers runs on Rush Street Interactive’s platform. It’s… not pretty. The lobby looks dated. Table animations feel sluggish. Feature set trails the competition by years.
And players don’t care.
Mobile usage hits 67% on BetRivers versus 51% industry average. The simplified interface that power users mock? Recreational players prefer it. Fewer options mean fewer decisions. Fewer decisions mean faster gameplay.
The platform’s integration with Rush Street’s casino vertical matters too. Cross-selling data shows 78% of BetRivers poker players also use their casino products. That’s double the industry norm.
Tournament Economics Tell the Tale
BetRivers’ Spring Championship generated $89,000 in tournament fees across 35 events. Average buy-in: $82. Field sizes: 180-350 players.
Compare that to PokerStars’ PASCOOP running simultaneously. Average buy-in: $215. Average field: 425 players. Total fees collected: $312,000.
Stars collected 3.5x the fees with only 2.4x the volume. But BetRivers’ completion rate - players who finish tournaments rather than late register and punt - hit 84%. PokerStars: 61%.
Different player pools. Different behaviors. Different economics.
Marketing Without Marketing
BetRivers spent $47,000 on poker-specific marketing in Pennsylvania during Q1 2026. PokerStars spent $580,000.
Per dollar of marketing spend, BetRivers generated $4.20 in revenue. PokerStars: $0.71.
The difference? BetRivers doesn’t acquire poker players. They convert existing casino users. Their customer acquisition cost effectively becomes zero when you allocate it to the casino vertical.
Phil Hellmuth’s streaming deal looks expensive until you realize they’re not paying for poker acquisition. They’re paying for casino brand awareness.
What This Actually Means
National operators chase liquidity because they think like poker players. Bigger fields, higher stakes, more prestige.
Regional operators think like casinos. Lifetime value, session frequency, cross-sell rates.
The data suggests regional operators might have it right. BetRivers’ 23% year-over-year growth outpaces every national brand. Their player retention at 180 days sits at 73% versus 45% industry average.
We’re watching two different business models compete. One optimizes for poker players. One optimizes for gambling entertainment consumers who sometimes play poker.
The $737,000 month suggests which model wins.


